Monday 31 December 2012

Linking ORBIS to Pelagios

Parameterized route finding in ORBIS
ORBIS: The Stanford Geospatial Network Model of the Roman World has recently joined the Pelagios network, thanks to the encouragement and patient assistance of Leif, Elton and Rainer.

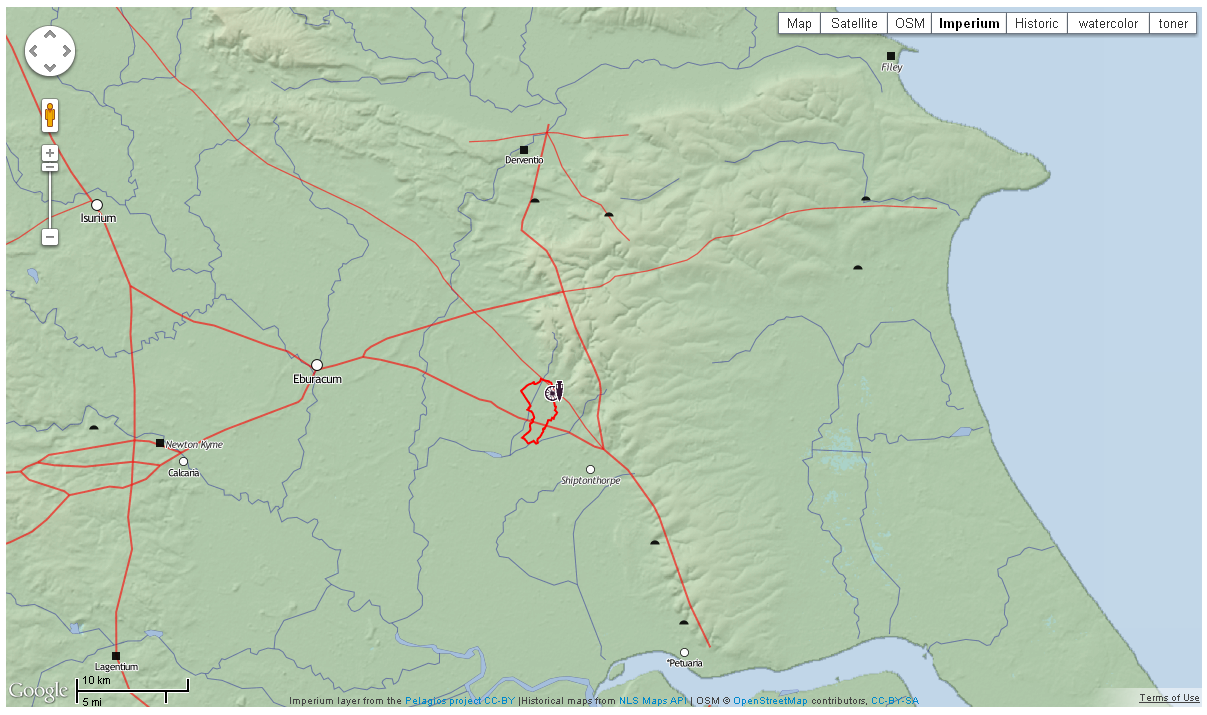
Our initial steps were these: (a) create an API allowing a few simple RESTful queries of the ORBIS database (orbis.stanford.edu/api), (b) publish an RDF file which maps our URIs for 402 of ORBIS’ 751 sites to Pleiades places, and (c) build a simple dynamic map landing page for the URIs.

Project background

The initial phase of the ORBIS project was completed with a web site launch in May, 2012. Development has largely paused for several months, but will resume in early 2013. The goal of the project is to model Roman communication costs in terms of both time and expense, and to permit scholars and the general public to interact with that model, by means of a route-finding web map and an interactive distance cartogram. By simulating movement along the principal routes of the Roman road network, the main navigable rivers, and hundreds of sea routes in the Mediterranean, Black Sea and coastal Atlantic, the model reconstructs the duration and financial cost of travel in antiquity. The purpose, development and use of the model and web application are described in considerable detail on the site.

Interactive distance cartogram in ORBIS, showing ‘grain-distance’ to Rome during June, in denarii
The ORBIS project is led by Walter Scheidel (Professor of Classics and History); the novel geospatial model, database and cartogram were developed by Elijah Meeks (Digital Humanities Specialist). Yours truly (Karl Grossner, Digital Humanities Research Developer) arrived to the project in time to become its web developer.

So, what does ORBIS add to the growing graph of annotations to Pleiades places that Pelagios enables? The initial answer is that for each of 402 places we can tell you which Pleiades places are directly connected to it by a single network segment. In the coming weeks we will be extending both our annotations and the range of API queries, and report that here.

ORBIS places

The ORBIS database includes 751 sites, most of them urban settlements but also including important promontories and mountain passes; 268 of these served as sea ports. ORBIS sites are drawn, with a few adjustments, from the Barrington Atlas of the Greek and Roman World (Talbert 2000). The Barrington map key categorization for size and importance of settlements is maintained, in five rank classes (in ORBIS: increments of 10, 60 to 100). Of the 751 sites, 402 have been identified as identical with Pleiades places, and this is the basis for ORBIS’ connection to the Linked Data cloud.

The road network encompasses 84,631 kilometers of roads and desert tracks, and 28,272 kilometers of navigable rivers and canals. This multi-modal terrestrial network is described in the spatial database in terms of 625 distinct road segments and 107 distinct river or canal reaches. As an aside, these segments and reaches are places as well—certainly events have occurred at, on, or near them. Granted the first order of business in our collective effort at large-scale digital historical gazetteers is point locations, principally for settlements. However, named and unnamed paths (e.g. roads, rivers) and potential or actual routes taken upon them (journeys or trajectories), are entities of interest as well—as sites of historical activity and events.

Creating an API

The ORBIS routing application calculates routes between sites, along a multimodal network comprising the terrestrial segments mentioned above, and a 0.1 degree lattice laid over the Mediterranean and Black Seas and North Atlantic Ocean. The route calculation accounts for 8 parameters, each with multiple possible values: start (639), destination (639), month (12), priority (3), network type (5! = 120), river vessel (2), sea vessel (2), land vehicle/mode (9), and price (3). Obviously, results for these billions of distinct combinations can’t be (and needn’t be) pre-calculated and published; a simplified API can deliver results programmatically. So, what to offer in an API? We have begun simply. You can request for example,
  • A dump of all 402 sites mapped to Pleiades places, in JSON format
    http://orbis.stanford.edu/api/sites
  • A listing of sites one network hop from a given site (using either Pleiades place ID or ORBIS site ID) by road or river, with segment length, e.g
    http://orbis.stanford.edu/api/sites/108772
  • A route between two places. There are four required parameters: start, destination, month and priority (fastest or shortest route). For example,
    http://orbis.stanford.edu/api/route_pl/79299/108772/6/1
    requests the shortest path between Aquae Sulis and Augusta Suessionum in June using Pleiades IDs—and returns a JSON object with the estimated trip distance and duration, and a sequence of 7 segments (6 road, 1 coastal sea). For each segment, distance, duration and type are returned as well.

API technical details

Because ORBIS uses PHP for database access, and the syntax we preferred uses slashes (like orbis.stanford.edu/{param1}/{param2}/{param3}, I found the Slim API framework (http://www.slimframework.com/) to be simple and effective. In our case this meant a central index.php referring to separate PHP scripts for each of our three offerings, and a single mod_rewrite statement added to our Apache web server configuration. The API queries are simplified version of existing queries in the ORBIS application. For further details, just contact me.

RDF publication

Pelagios required first and foremost a web-published RDF document describing (minimally) mappings between ORBIS sites and Pleiades places, in the form suggested by the Open Annotation Collaboration (openannotation.org ). One such entry is as follows:

<rdf:Description rdf:ID="orbis_50012">
    <rdf:type rdf:resource="http://www.openannotation.org/ns/Annotation"/>
    <oac:hasBody rdf:resource="http://pleiades.stoa.org/places/108751"/>
    <oac:hasTarget rdf:resource="http://orbis.stanford.edu/api/site/50012"/>
    <dcterms:creator rdf:resource="http://orbis.stanford.edu/"/>
    <dcterms:title>The Roman era place, Ara Agrippinensium</dcterms:title>
</rdf:Description>


Generating this document was straightforward for us; the ORBIS sites table has always included a Pleiades ID field, and we had already made 402 mappings there. A SQL query that concatenated the necessary XML markup with site numbers and Pleiades IDs was a simple matter. The file can be freely downloaded, but is presently useful only to Pelagios.

Web landing page

The URIs published in the above file have to resolve to a meaningful location. Navigating to http://orbis.stanford.edu/api/site/50012 loads a page with a small map with markers for that site and the sites directly connected by a single segment to it.

A few comments

The ORBIS site does offer the option to export lists of calculated routes as KML for Google mapping, or comma-delimited format (CSV) for more general use. This is good as far as it goes, but we are intrigued at the prospect of ORBIS routes and related data being mashed up in other applications, and see a potential ‘multiplier’ effect in this capability. The ORBIS project will also be a partner collection in Anvil Academic’s Built Upon digital publishing initiative, which may present novel opportunities for linked data applications.

Pelagios allows anyone referring to a Pleiades place to discover other annotations for it, now including those of ORBIS. However, given the parametric nature of ORBIS data, what can a simple static URI provide?  For the time being, this is only the set of Pleiades places connected to that place by a single terrestrial segment. This seems to me of limited value, although as a Linked Data devotee I understand my job is simply to publish data, enabling applications we can’t necessarily predict. The API we’ve developed to return parameterized routes appears more immediately useful, and in fact we know of one pending application related to paths between coin finds and nearby mints. The annotation provided through Pelagios could be extended, but how? For example, would it be useful to provide, for a given place, distances and durations to all places of a given size or importance? Suggestions are most welcome.

______________________

Talbert, R. J. A. (ed.) 2000. Barrington Atlas of the Greek and Roman World. Princeton.

Friday 5 October 2012

Bringing the “Book of the Dead” Places to Pelagios

The Book of the Dead is a collection of spells which accompanied the deceased in the realm of the dead. The spells supplied information about the residents, places and incidents in the afterlife which helped the dead person to avert danger and to be accepted among the gods. Altogether, the Book of the Dead - as a text corpus - comprises c. 200 spells. The actual composition of a single book, in contrast, varies, so that each source is unique.


The instances of the Book of the Dead are transmitted on papyri, mummy wrappings, shrouds, coffins etc. In total, there are nearly 3000 objects. Their records and photographs (~ 20.000) have been gathered and worked on within the Book of the Dead Project which started at the University of Bonn in the 1990s. Recently, they have been integrated into a digital archive, in cooperation with the Cologne Center for eHumanities (CCeH).

There are two kinds of place references included in the data records: references to the object's current location (country, place and institution) and to their provenance (place of origin and specific locality). The latter are being integrated into the Pelagios network. 

Alignment to the Pleiades Gazetteer


In terms of granularity, the places of origin have been chosen for the mapping as their level of granularity corresponds roughly to the level of the precisely located places identified in Pleiades (e.g. Athribis or El Kurru).
The first step in the alignment process was to import the Pleiades+ dataset via Oxygen and convert it to XML. This was done because the digital archive is based upon an eXist database and the data thus reside entirely in the XML cosmos. An XSLT script was written to map the Book of the Dead place occurrences to the places in the Pleiades+ dataset. That way, about half of the places could be mapped automatically. The results were checked in consideration of the geographic coordinates given in the archive. There was only one mismap: "Theben" was mapped to the Greek Thebes instead of the Egyptian Thebai.
Most of the remaining places were identified manually by means of their corresponding Greek place names. In the archive, a great deal of the place names are German transliterations of Arabic names. Up to now about 90% of the place names have been identified. 


Annotation and Dataset Metadata Creation


A main component of the digital archive's data model is an external knowledge base simply called "Wissen" (knowledge) bringing together additional information such as geographic coordinates, year dates for periodization, canonical and selective lists for spells, degrees of kinship. Part of this and relevant to the Pelagios alignment is a distinctive list of places of origin, to which the Pleiades IDs have been assigned.


An XQuery module was created to provide single annotations, a dataset dump and a dataset metadata description in RDF/XML. Single annotations and the dataset dump are created on the fly by joining the data record's place occurrences to the Pleiades IDs in the knowlegde base. So far, the annotations are organized as one single dataset as their number is relatively small (currently, there are 1346 annotations).
As a next step the Pelagios tools and widgets will be explored in order to deploy them on the Book of the Dead project website.

Tuesday 2 October 2012

The Portable Antiquities Scheme joins Pelagios

Hacking Pelagios rdf in the ISAW library, June 2012
Earlier in 2012, the excellent Linked Ancient World Data Institute was held in New York at the Institute for the Study of the Ancient World (ISAW). During this symposium, Leif and Elton convinced many participants that they should contribute their data to the Pelagios project, and I was one of them.

I work for a project based at the British Museum called the Portable Antiquities Scheme which encourages members of the public within England and Wales to voluntarily record objects that they discover whilst pursuing their hobbies (such as metal-detecting or gardening). The centrepiece of this projects is a publicly accessible database which has been on-line in various guises for over 13 years and the latest version is now in the position to produce interoperable data much more easily than previously.

Image of the finds.org.uk database
The Portable Antiquities Scheme database

Within the database that I have designed and built (using Zend Framework, jQuery, Solr and Twitter Bootstrap), we now hold records for over 812,000 objects, with a high proportion of these being Roman coin records (175,000+ at the time of writing, some with more than 1 coin per record). Many of these coins have mints attached (over 51,000 are available to all access levels on our database, with a further 30,000 or so held back due to our workflow model.) To align these mints with a Pleiades place identifier was straightforward due to the limited number of places that are involved, with the simple addition of columns to our database. Where possible, these mints have also been assigned identifiers from Nomisma, Geonames and Yahoo!'s WOEID system (although that might be on the way out with the recent BOSS news), however some mints I haven't been able to assign - for instance 'mint moving with Republican issuer' or 'C' mint which has an unknown location.

Once these identifiers were assigned to the database, it allowed easy creation of  RDF for use by the Pelagios project and it also facilitated use of their widgets to enhance our site further. To create the RDF for ingestion by Pelagios, our solr search index dumps XML via a cron job cUrl request, which is transformed by XSLT every Sunday night to our server and uses s3sync to send the dump to Amazon S3 (where we have incremental snapshots). These data grow at the rate of around 100 - 200 coins a week, depending on staff time, knowledge and whether the state of the coin allows one to attribute a mint (around 45% of the time.) The PAS database also has the facility for error reporting and commenting on records, so if you use the attributions provided through Pelagios and find a mistake, do tell us!

At some point in the future, I plan to try and match data extracted from natural language processing (using Yahoo geo tools and OpenCalais) against Pleiades identifiers and attempt to make more annotations available to researchers and Pelagios.

For example, this object WMID-3FE965, the Staffordshire Moorlands patera or trulla (shown below):

Has the following inscription with place names:

This is a list of four forts located at the western end of Hadrian's Wall; Bowness (MAIS), Drumburgh (COGGABATA), Stanwix (UXELODUNUM) and Castlesteads (CAMMOGLANNA). it incorporates the name of an individual, AELIUS DRACO and a further place-name, RIGOREVALI. Which can further be given Pleiades identifiers as such:
  1. Bowness: 89239
  2. Drumburgh: 89151
  3. Stanwix: 967060430
  4. Castlesteads: 89133

Integrating the Pelagios widget and awld.js

Using Pleiades and Nomisma identifers allows the PAS database to enrich records further via the use of rdfa in view scripts and by the incorporation of the Pelagios widget and the ISAW javascript library on a variety of pages. For example, the screenshot below gives a view of a gold aureus of Nero recorded in the North East of England with the Pelagios widget activated:
The pelagios widget embedded on a coin record:  DUR-B4E094 
The javascript library by Nick Rabinowitz and Sebastian Heath also allows for enriched web pages, this page for Nero shows the libary in action:

These emperor pages also pull in various resources from third party websites (such as Adrian Murdoch's excellent talking head video biographies of Roman emperors), data from dbpedia, nomisma, viaf and the site's internal search engine. The same approach is also used, but in a more pared down way for all other issuer periods on our website, for example: Cnut the Great.


Integrating Johan's map tiles

Following on from Johan's posting on the magnificent set of map tiles that he's produced for the Pelagios project (and as seen in use over at the Pleiades site and OCRE), I've now integrated these into our mapping system. I've done it slightly differently to the examples that Johan gave; due to the volume of traffic that we serve up, it wasn't fair to saddle the Pelagios team with extra bandwidth. Therefore, Johan provided zipped downloads of the map tiles and I store these on our server (if you're a low traffic site, feel free to use our tile store):
Imperium map layer, with parish boundary. Zoom level 10.
The map zoom has been set to the level (10 for Great Britain) at which we decided site security was ensured for the discovery points (although Johan has made tiles available to level 11). This complements the other layers we use:

  • Open Street Map
  • terrain 
  • satellite
  • soil map
  • Stamen map watercolor
  • Stamen map toner 
  • NLS historic OS maps
Each find spot is also reverse geocoded for a WOEID and Geonames identifier to be produced, elevation to obtained and subsequently we link to Aaron Straup Cope's excellent woedb for further enhancement of place data.  We also serve up boundaries derived from the Ordnance Survey Opendata BoundaryLine dataset, split from shapefiles and converted to KML by ogr2ogr scripts. The incorporation of this layer allows researchers (over 300 projects currently use our data) to interpret the results that they get from searches on our database against the road network and settlement data much more easily and has already gathered many positive comments from our staff and research colleagues.

By contributing to the Pelagios project, we hope that people will find our resources more easily and that we in turn can promote the efforts of all the fantastic projects that have been involved in this programme. What we've managed to implement from joining the Pelagios project already outweighs the time spent coding the changes to our system. If you run a database or website with ancient world references, you should join too!


Monday 1 October 2012

2-Way Linked Data? It just, you know, works.


Another title for this short post could be "ISAW Papers now in Pelagios," but that's a little dry. And beyond announcing more data in the growing ecosystem, I do want to highlight the "2-way" part of this most recent addition.

 But first, what's ISAW Papers? That's easy. It's the online journal of NYU's Institute for the Study of the Ancient World (ISAW). Following the link will take you to more information.

 Here's another link, this one to the first ISAW Papers annotations, with more to come soon. And just FYI, those are currently all from ISAW Papers 2 by Catharine Lorber and Andrew Meadows so many thanks to them for being part of the fun.

 Next question is, "What do you mean by '2-way'?" In the list of annotations I linked to above, there is one to "Cyprus" that shows the URL:

Note the fragment identifier "#p8". The archival format of an ISAW Papers article is HTML, which makes it easy to assign an identifier to every paragraph. As part of its publication model, ISAW partners with NYU's library to deliver articles, and that relationship is the source of the link you see above. The library runs the 'dlib.nyu.edu' host. If you click above, it will take you directly to the eighth paragraph of ISAW Papers 2.

 But that's still just one-way linked data. Try hovering over the underlined reference to Cyprus. You should see a map in a pop-up, next to which is a link to "Further references at Pelagios". Follow that to the Pelagios page telling you there is a reference to Cyprus in ISAW Papers as well as in other resources.  It's 'two-way' in that you can go back-and-forth, back-and-forth on the basis of the stable identifier for Cyprus as provided by Pleiades. And as many of you may know, clicking through to the Pleiades page will show the link to ISAW Papers. Now we're talking N-way linked data, which is what we really want. As in, "Now we're talkin'! Sweet!!!"

 And just for further context, the pop-up is implemented by the "Ancient World Javascript Library," another ISAW project hoping to deliver usable tools to all who might be interested in them.

 Of course, the "just works" part of the title downplays all the effort by many people to make this seamless. But that's how it should look to users. With such ease-of-use coming into being, it will be cool to see what people do with all these links.

Tuesday 25 September 2012

Squinchpix’s experience converting to Pleiades-compliant names


The process of using Pleiades names consists of getting access to the specific name IDs.  Pleiades provides a site that will return these IDs here: http://pleiades.stoa.org/places/

On that page the user can type in the required name and retrieve the ID in the resulting URI.
SquinchPix actually maintained no location information for the pictures in its DB.  The place names are embedded in the captions, of course, and in the tag or keyword tables.  But the tag ‘Rome’ is not treated any differently from the tag for, e.g., ‘concrete’ or any other tag.  As a result there is no easy way to specifically pick out place name tags in an automated fashion.  What SquinchPix has done all along is maintain a pretty accurate lat/long pair for every picture.  It’s the lat/long pairs that drive location services on SquinchPix such as the Google map that gets generated dynamically for every image. 

In order to participate in the Pelagios project SquinchPix decided to make two changes to the DB.  In the table which contains information for each picture (‘PI’) a field was added for an unambiguous modern name for the location of the picture. 

Then came the work of actually rooting out the place names from the keyword table and associating the right place name with the right picture.  We wrote a script that looked for all the pictures that were keyworded ‘Rome’.  Those that were keyworded ‘Rome’ had the word ‘Rome’ entered in the new dedicated place name field by the script.  The script just dumped out the captions for those which were NOT keyworded ‘Rome’.    Then we inspected those captions looking for more place names.  Next came ‘Athens’, then ‘Mycenae’, ‘Naples’, ‘Tiryns’ and the rest.  For each new place name the script labeled that many more pictures and forced out fewer and fewer captions.  From 20,000 pictures without place names we used iteration to reduce that number to about 300 after two days of work.  By the end of that time each locatable picture had a specific place name associated with it.  The remainder were almost all pictures of artifacts with no secure find spot.  That remainder could probably be identified with some larger Pleiades-compliant name such as ‘Syria’, or ‘Mediterranean’ but that work is for another stage.

The second big change to the DB  was the creation of a separate table that used that same modern place name established in step 1 as an index to a set of doubles.  The doubles were simply the corresponding Pleiades-compliant name and the Pleiades ID.  This table was populated by hand, entry by entry.  On SquinchPix there are about 170 distinct and unambiguous place names so that there are that many records in this new table.  In addition to using the Pleiades look-up facility we made use of the .kml which we ran in Google Earth in parallel.  If we couldn’t find the place in Google Earth then we used the look-up facility.  Even though dealing with a much smaller number of records this hand-population took about four days.

Once that table was populated we had a secure way of going from the specific picture to its modern place name and then to the Pleiades-compliant name/ID pair. Now we simply wrote a script that would traverse all the pictures, get the Pleiades-compliant name and number and use it to write out the Turtle-compliant record. In this way (the extra table, that is) we could confine the fluctuating nature of the Pleiades project to a ‘localized’ corner of the DB. We anticipate that this table in our DB will change and will be maintained and updated on an ongoing basis. The reason for this is that Pleiades is dynamic and also our ideas about specific places and names may not mesh cleanly with theirs in all instances thus necessitating the occasional negotiation. To their credit they are very responsive to questions and suggestions about place names. I would urge anyone engaged in a conversion project to communicate with them whenever better ideas about place names or locations should surface.

Thursday 20 September 2012

Geographical information retrieval - finishing touches

In my last post back in July I wrote about the development of a set of APIs and an interface for geographically querying historical places and their annotations, which allows users to browse a long lost territory and retrieve information about historical artefacts. However, even an application as simple as a map visualisation wouldn't be possible, if services, data, and tools weren't made available to the community by a number of different parties. Naming all those upon whose work I have built is no easy thing. But the following have been especially helpful:
Even this short list gives a measure of the collaborative nature of research and development in this area. I owe a debt of gratitude to all of those who have provided the above resources and obviously to all of those who enabled them to do so. Below I go into a bit more detail about my finishing touches to the interface for retrieving geographical information about the ancient world. But, for those of you impatient to see the result, you can go straight to the heat map by clicking here.

Correction of box annotations

A few corrections have been made on the annotation API in order to return only annotations for which the actual geographical context was a point. It was in fact made known to me, thanks to Leif Isaksen, that in many maps the heat spots were strangely clustered at the intersection of nodes in a grid.    

Grid effect on heat spots
The effect is quite clear when visiting a province like XI, in Italy, where the spots are seen clearly positioned in an organised grid. Not only. It seems in fact that for regions like these, the majority of the annotations are grouped in this way. Clearly, the presence of numerous annotations like these undermine the purpose of having a heat map in the first place since the information about the original place associated to an annotation is lost and the contribution from the precise annotations is somewhat shadowed.

For this reasons all annotations whose geographical context is not a point has been ruled out as contributors for the final heath map, obtaining as a result a more informative map where hot spots are grouped around historical settlements like in the figure below.

Heat map without box annotations

Integration of Historical tile sets

An interesting addition to the interface is the adoption of a particular tile set for historical regions developed by Johan Ã…hlfeldt in his project Regnum Francorum Online (a description of his work can be read in this blog here). The tile set allows users to provide a background for historical maps which includes names of ancients settlements and depicts also well known roman roads (like the Appian way) alongside known mines and sanctuaries.

Seeing the actual historical landscape with the original names and connections among settlements can only increase the allure of exploring archaeological artifacts and in fact provides the best context in which to put what can be accessed via the different APIs from the Pelagios data galaxy.

This work has been supported by Pelagios and I'd like to thank Leif Isaksen, Elton Barker, Rainer Simon and Johan Ã…hlfeldt for sharing their ideas, support and resources.

Gianluca Correndo
Research fellow WAIS group Electronic and Computer Science University of Southampton
   

Wednesday 19 September 2012

A digital map of the Roman Empire

Background

The Barrington Atlas of the Greek and Roman World was published in 2000 as part of an international effort to create a comprehensive map and a directory of all ancient places mentioned in sources and a selection of important archaeological sites. Since then two digitization efforts based on the Barrington Atlas have come into being, Pleiades, which started off as a historical gazetteer,and the DARMC project, which is a layered historical atlas. In 2010-2011, as part of a common project, the geodata of DARMC was transferred to Pleiades, though, unfortunately, not all the places in the original Barrington directory could be matched between DARMC and Pleiades, resulting in many places without precise coordinates and feature data. Nonetheless, ever since, the Pleiades gazetteer has had the ability to display most ancient places on a map, individually and with their immediate surroundings, using Google Maps API and Google Maps as background layer. In March 2012 the Ancient World Mapping Center launched a first version of an online GIS application called Antiquity À-la-carte, covering the entire Greco-Roman World. This application is also based on the Barrington Atlas, on geodata from Pleiades/DARMC, and its own digitization efforts (roads, aqueducts, ancient coastlines).

Yet, while the DARMC and Antiquity à la carte initiatives provide geographical coverage and exiting possibilites to compose custom maps in layers, until now there has been no digital map that can be used as background layer for use in a fashion similar to modern mapping applications like Google Maps. Thanks to Pelagios, this is work that I have undertaken, with a view to aiding any archaeological or historical research interested in or using online mapping. We are releasing the map with a CC-BY license, allowing anyone not only to browse and consult it but also to use it for representing their own data or to build on it their own applications, provided that they include a proper scholarly attribution. What is more, the map can be used with OpenLayers, Google and Bing maps, so that anybody, who already has these systems in place, can easily swap out the map tiles for these historical ones.

To see the basic background map (using Google Maps API), click here (default setting is Rome, zoom level 7 of 11). For information about the making of the map, sources of geodata, and a legend to the symbols, click here. For those of you interested in finding out about how the map came into being, keep reading!

Aim
The aim of my work with Pelagios has been to create a static (non-layered) map of the ancient places in the Pleiades dataset with the capacity to serve as a background layer to online mapping applications of the Ancient World. Because it is based on ancient settlements and uses ancient placenames, our map presents a visualisation more tailored to archaeological and historical research, for which modern mapping interfaces, such as Google Maps, are hardly appropriate; it even includes non-settlement data such as the Roman roads network, some aqueducts and defence walls (limes, city walls). Thus, for example, the tiles can be used as a background layer to display the occurrence of find-spots, archaeological sites, etc., thereby creating new opportunities to put data of these kinds in their historical context.

The ancient places and their names have been rendered on a topographical map created from elevation data, originally from the Shuttle Radar Topography Mission (SRTM) project at NASA. The map itself is created as a tiled mapset in the Spherical Mercator projection (EPSG:3857), used by most webmapping services. It is compatible with Google and Bing street and satellite maps, OpenStreetMap, and can easilly be implemented with a javascript application programming interface (API), such as Google Maps and OpenLayers API. Work has taken two different forms: 1) preparation and improvement of the data; and 2) the rendering of the digital map. I elaborate on each item below.
Rome and Central Latium at zoom 9, click to display the full image.

Limitations
In a departure from the original Barrington Atlas and the Pleiades dataset, our digital map does not try to implement time periods when places are attested, nor does it speculate on the certainty (or otherwise) of locations: only precise locations from the Pleiades dataset can be rendered on the map. Nevertheless, since many places lacked precise coordinates and/or feature data, a good deal of effort has been made to improve the data. For sake of clarity, we have displayed only one of an ancient place's possible names, based on its primacy and importance in the Barrington Atlas. The digital map is presented at eight different zoom levels (3-10: zoom 10 corresponding to a scale at approx. 1:500,000), and one additional zoom level (zoom 11, which corresponds to a scale at 1:300,000) for maps of Central and Southern Italy, Northern Tunisia, Greece, Turkey, Syria, Lebanon, Israel, Palestine, Egypt and Jordan. Due to the lack of precise coordinates in the original dataset for regions, cultural (tribes, people) and natural features (mountains). thus far only places have a complete rendering on the map, while major rivers and lakes have been labelled with Latin names.
These considerations have been made to keep the map simple and easy to understand, which is a necessity for online publications, especially for interactive maps that users may want to click on, pan and zoom.

Licence
The transmission of the tiles to any web-mapping application is permitted under a Creative-Commons 3.0 (CC BY-SA) licence. Attribution to the Digital Atlas of the Roman Empire (DARE) project at http://dare.ht.lu.se is required and linking to this blogpost is encouraged. See below for implementation instructions.


Making of the map
There is a short description how the map was made at a separate page. Here you will also find the legend of the map and a listing of datasources for the geodata of the map. The map can be viewed in fullscreen mode at this page.


Preparation and improvement of the dataset

Georeferencing the Barrington Atlas

The Barrington Atlas used maps at three different scales. The central Mediterranean provinces of the Empire were rendered at 1:500,000, which corresponds to zoom level 10 on the digital map (which is 1:545,979 to be exact), peripheral provinces like Britannia, Germania, Belgica and Gallia were rendered at 1:1,000,000 (zoom level 9). There were also special maps of Rome, Carthage, Athens, Constantinople and their surroundings at 1:150,000 scale (zoom level 12). The accuracy of georeferencing the 1:1,000,000 scale Barrington maps, given that the places are located correctly on the printed map, is around 3 kilometers, which is illustrated in the online example 1, where georeferencing using different sources of information is described.
Example 1: Georeferencing the sanctuary Sanxay, dep. Vienne, France using different sources.

Over the past few years, the conditions for successful georeferencing of ancient places has increased. Nowadays there is better satellite imagery; national mapping agencies offer APIs to quality maps (e.g. Géoportail, IGN, France and OpenSpace, Ordnance Survey, Great Britain); georeferencing services have better accuracy, with the result that e.g. Google Maps Geocoding Service can return places that aren't even visible on their own maps (e.g. small hamlets); main archaeological monuments throughout Europe and the Middle East have their own articles on Wikipedia, often with highly accurate coordinates; national heritage agencies offer online database services, etc.

Additional data from Barrington Atlas

From the beginning it was clear to me that, since we were creating a map, we would require information that was not included in the original Pleiades dataset, and also that it was necessary to render ancient and modern placenames in a different way. One such example was the relative importance of a place. In the Barrington Atlas, places were represented in a hierarchy of importance through the use of font and its size, so that, for instance, those places considered of greatest significance - capitals, settlements with the legal status of colonia and municipia, legionary bases, important sanctuaries and mines - were rendered using capital letters. On our map, we let those places appear first, so that users can immediately locate themselves in the landscape and grasp at a glance those places which have greatest prominence in our sources.
The Barrington Atlas and the use of font and font-size to indicate relative importance among places. Minturnae (Minturno, Italy) is the most important place on this map, allthough all placenames with capital letters (Sinuessa, Suessa Aurunca and Interamna Lirenas) are assigned to the category of major settlements on the digital map.
After careful and repeated study of the Barrington Atlas, I found a total of 1488 places indicated as important on the map by its font and size (capital letters), mainly settlements, but also legionary fortresses, rural sanctuaries (in fact there are three of them, all Greek: Olympia, Nemea and Isthmia), to a residence, the villa of emperor Hadrianus, near Tivoli (outside Rome). In our dataset, these places have been assigned a major/important property allowing them to appear on the map before other places (i.e. at lower zoom levels) and depicted with bigger symbols and font. Even given the time restriction of the project, we decided that it was important to get the features and coordinates of these places as accurate as possible. Some belonged to those cases where Pleiades and DARMC had trouble aligning their datasets, especially those places sharing the same ancient name. For instance, only one of the two important places in Britain names Isca had precise coordinates in the Pleiades dataset (that named Isca = Caerleon, Exeter), and only one of three of the cities (that named Venta = Caerwent, Winchester, Caistor-by-Norwich).

Implementation of the map
I have prepared two simple examples of the implementation of the background map, one using the Openlayers API, example 2, and the other using Google Maps API, example 3. (Feel free to study the HTML code, which contains all the Javascript. The path to the directory on the Pelagios server where the tiles are stored is located at
http://pelagios.org/tilesets/imperium/{z}/{x}/{y}.png
Implementation in Google Maps uses the ImageMapType class, which is used to define a custom map type with the same behaviour as the default map types, whereas implementation in OpenLayers uses the Layer.XYZ class. The path must be specified in the JavaScript code, see the documentation for details.
There are several ways to get your data on the map, though it is beyond the scope of this article to go into the detail. The simplest way is just to place a marker at a specific location on the map: with its political and cultural infrastructure, our presents offers a favourable comparison to modern streetmaps in the display of information. Another popular way is to load a Keyhole Markup Language (KML) file into your webmapping application. This is demonstrated in example 4 (OpenLayers) and example 5 (Google Maps), where a KML-file containing the Roman milestones in Western Continental Europe is loaded.

I have set up a fully interactive implementation of our digital map at  dare.ht.lu.se. The web application uses the OpenLayers API. There is a two way interaction between the map and a backend SQL database, containing data about the ancient places. Information about the places can be retrieved in three different ways:
  1. directly, by clicking the symbols on the map;
  2. listing the places currently displayed on the map;
  3. by entering a search expression of an ancient or modern name or part of a name.
Results of your query appear in the right sidepane. It is also possible to display a detailed view of the site using Bing Satellite Maps or OpenStreetmap.

Conclusion
This is the first version of a digital map inspired by the majestic Barrington Atlas. Our map cannot really do it justice, first because of the complex nature of the original, second for the reason that much work remains to be done, with respect to both developing digital mapping techniques and to improving the quality of the feature data. In another way, however, this map goes beyond the scope of the Barrington Atlas, because - as a digital product - it can be expanded to much higher zoom levels and be connected interactively with users, other maps and georeferenced data of any kind (plans, drawings, photos, etc.)

For the future I envisage more places being included in the database: a digital map has no restriction in space, whereas the Barrington Atlas was constrained by the physical size of its pages (which even then were big, as any owner of the Barrington knows!). In this version I have stopped at zoom 11: however the freely usable OpenStreetMap continues to zoom 18 and already contains highly accurate data about the structure and shape of many archaeological sites. In addition, the OpenCycleMap, among others, has shown that elevation data from the SRTM dataset can be rendered at zoom level 14 with some interpolation. Finally, national agencies (e.g. IGN, France) are continuing to release land-use data that are being incorporated in the OSM dataset. Therefore I see a growing archaeological map of the Ancient World, not only a historical map.

Meanwhile the author is looking forward to hearing about your experience of this map, so that together we can improve our understanding of ancient world geography using twenty-first century technologies.
This work has been supported by the Pelagios project, and I would like to thank Leif Isaksen, Elton Barker and Sean Gillies (Pleiades), who provided ideas, support and feedback.
Johan Ã…hlfeldt
Digital Atlas of the Roman Empire (DARE)
Department of Archaeology and Ancient History, Lund University, Sweden

Monday 17 September 2012

SquinchPix joins Pelagios


When in Rome a few years ago, we came across the Santa Costanza, a beautiful 4th century AD church with the most amazing mosaics. But, when we tried to find pictures of them on the Internet afterwards, we drew a blank. Then and there we resolved to photograph the mosaics in their entirety and put the results on line for other people to enjoy. Thus SquinchPix.com was born.

SquinchPix.com is our archival site for photographs of historical cultural artefacts in Europe, including archaeological sites, buildings, artworks—basically anything that has historical interest and looks great! We aren’t affiliated with any institution or school: but, the more images we have captured, the more we have become convinced that the salient characteristics of digital photography—they’re easy (to take and upload), free and resilient—along with the potential for the Internet to bring these pictures to a mass audience, must be leveraged to assist researchers and students.

The real transformative potential of digital photography has yet to be fully realised. For example, whereas previously a single photograph of the Temple of Hephaestus in Athens was all that the book publisher’s budget would allow, it's now possible to photograph every capital, every sculpture, every cut in the marble, and put it all online for no increase in cost (for no cost at all, really). We also understand that the researcher needs clarity, so we exercise significant post-processing on the photos to make enhance their quality. The result is that often even very prosaic objects, such as column bases, can reveal a new and unexpected beauty. Of course, we can always do better: but, as the technology improves, so do our pictures.


Protome of a griffin.  Bronze cauldron attachment.  Olympia, Greece.  After 650 BC.  


Yet, despite this breakthrough in technology, there are many internet sites aimed at researchers where the proprietors still think like book publishers: what large-scale inclusion requires is a corresponding increase in the sophistication of the user interface. On SquinchPix every photograph is extensively tagged (keyworded). Currently our database holds a third of a million keywords for about 21,000 photos, which enables powerful searching across and aggregation of the records. In addition, every search term can be displayed as a tag- or keyword-map that shows what other terms on the site are associated with your search term and with what frequency: a click of the button brings up the corresponding image subsets. So, from finding one picture to relating a picture to many others—that has been SquinchPix’s journey.


Terracotta vessels arranged by century on SquinchPix.

It is for this reason above all that we are delighted to join Pelagios. Now our photographs can be related to many other kinds of data­—including archaeological data about them or text documents that refer to the place where they’re found—which will help provide fascinating layers of context for our images. We hope too that our photos may prove useful to be read alongside textual descriptions and archaeological records, thereby providing another dimension to the data already part of the Pelagios cloud. Our first drop of 1500 pictures taken in and around Athens, Greece will soon be available, so watch this space!

Just a short note on usage: researchers, lecturers, teachers and students may use our pictures at no cost. We only request to be credited with some such line as ‘Courtesy of SquinchPix.com’ (every photograph has the photographer’s name on it or beneath it). Those who wish to use the pictures for commercial purposes should inquire. In addition we always like to know how our pictures are being used, so please do get in touch! Our e-mail is bob@squinchpix.com.

You can read more about us here:
http://kbender.blogspot.com/2012/02/photo-archives-old-and-new.htm 

http://www.wanderingeducators.com/artisans/lives-artists/exploring-classical-world-photographer-robert-consoli.html

Robert H. Consoli, Susan Hynnes.
SquinchPix.com

Wednesday 1 August 2012

Pelagios: Future Directions and Lessons Learned

Having come such a long way in a short time (it's hard to believe that the first phase of Pelagios began only last year), crystal ball-gazing is surprisingly challenging. On top of this, the UK and international funding landscape is rapidly changing, which may affect the kinds of research and development we can do in future. Nevertheless it is possible to identify some likely future directions of travel, as well clarify those services that we expect to sustain.

Sustainability

Pelagios was deliberately developed as a decentralised community of practice to minimise sustainability issues between development cycles. All annotations are hosted by the data partners themselves, so while it is possible for them to disappear individually there is no single point of failure. There is also a natural symmetry to this - the most likely reason for the annotations to disappear is if the resource they annotate goes offline, in which case the annotations would no longer point to anything anyway. The two major pieces of infrastructure we use - Pleiades and Open Annotation - have long term funding, but it is also worth noting that even were these services to disappear there would still be value in Pelagios annotations. They will create a network of connectivity between data partners, even if the the place URIs cannot be directly resolved.

The only components which require direct maintenance from the Pelagios community are the APIs and visualisation interfaces. These are used by some of our partners and so it would be unhelpful for them to be shut down. For that reason we have directed some of our funding towards a year's hosting, with the intention that it will tide us over until the next funding cycle. In case that should fail to materialise not all is lost, however. Our entire API and visualisation codebase is hosted on github and and can be installed anywhere else instead (several project partners have informally offered assistance in such an eventuality). This is entirely in the spirit of Pelagios - it is not our intention that the current API be the central access point, but that anyone should be able to set up APIs harvesting and serving data relevant to the needs of their own community. As the data is hosted independently there is no 'lock-in' or dependency on a single host.

Future Directions

There are many directions in which Pelagios can be taken and we are actively exploring several of them. Two forms of data we would like to include more of are maps and geographic writings. Although extant spatial documents from Antiquity are relatively scarce, they are extremely rich in content (sometimes with thousands of toponyms) and the associations between them are still far from clear. By digitally annotating geographical texts and images such as Ptolemy's Geography, the roman itineraries, the Peutinger Table, Strabo, Pliny, Pomponius Mela, and the Periplus of the Erythraean Sea, we would be able to explore the relationships between them in a far more powerful way. We could see at a glance the levels of coverage, as well as important omissions, or add contextual overlays to the documents themselves.

A second direction is to apply the lessons learned in Pelagios to other regions and periods of history. We are already in discussions about identifying gazetteers for late Antiquity and ancient and medieval China. The power of Pelagios is that it is equally applicable to any tie and place - it only requires that stable URI gazetteer be available. At a yet greater level of abstraction, the Pelagios framework can also be adapted to other conceptual entities, such as people, periods or canonical citations. Matteo Romanello is currently doing some very exciting work in the latter case which we have been following with interest. There is also a long running community discussion about creating a 'temporal' gazetteer' of historical periods, although it'srelationship to both place and individual assertions by scholars makes this a challenging topic.

However the space which seems to offer most promise currently is references to people. URI authority files such as VIAF already list a large number of well-known people from Antiquity. Likewise there are forthcoming digital prosopographies that could potentially offer stable URIs for less renowned citizens of Antiquity. By establishing a common service for discovering these URIs the stage would be set to annotate resources with references to people. This is not merely of interest to those researching ancient social networks. Because life spans are relatively short (historically speaking), references to people (and especially multiple people) are a powerful way of identifying the temporal salience of a resource, in addition to its spatial relevance. That can be extremely helpful when filtering through the thousands of annotations associated with a city like Rome or Athens!

These are just some of the ideas we hope to follow up on imminently or over time. We hope you find them as exciting as we do, and if you have an idea of how Pelagios could help facilitate your own work then do get in touch - we'd be delighted to hear about it.

Lessons Learned


And what have we learned along the way? Three key lessons stand out:

  1. Semantically formalizing references is a quicker win than semantically formalizing relationships. Much 'Semantic Web' research in the past has focussed on property and ontology-driven work that permits complex inferencing but is difficult to scale and has little value if the entities referred to are not already normalized. At this stage in the development of the Linked Data Web it may be best to focus on identifying common concepts (places, people, citations, taxonomies - anything you can 'point to'), which enhances discovery and lays the groundwork for the harder task of deriving and aligning ontologies from legacy data.
  2. The Web is designed to facilitate Openness and Decentralization. It doesn't necessarily follow that one ought to act in the spirit of these principles, but if you don't then you will be going against the grain of the technology. Because they are fundamental to Pelagios's goal (making independent ancient world resources easily and mutually discoverable), Web technologies have served us extremely well with few of the technical headaches that come from trying to keep things locked down or centralize everything in an 'ultimate solution'.
  3. Find your place in the ecosystem. Trying to do everything not only limits your horizons but is antithetical to the infinitely expansive nature of the humanities. Pelagios has proved successful by playing a small and tightly defined role in a community of partners who make equally vital contributions of various natures. This has allowed us to avoid mission creep and benefit from the excellence of our colleagues while giving back something in return. It has also allowed us to fully appreciate just how gracious, vibrant and giving the 'digital ancient world' community currently is. Continuing to foster a similar culture across the digital humanities will be fundamental to its success.
We'll look forward to learning further lessons in later phases of Pelagios, but for now it remains to thank the JISC Discovery Programme, all of our partners, and of course people like you, whose interest and support remains the lifeblood of the project. We'll continue to post updates in the coming months and if you have data you'd like to link to Pelagios then do get in touch!

Pelagios phase 2: the last post - for now

(To get a “live action” summary of what Pelagios is all about, watch the Elton and Leif double-act at the recent Digital Humanities 2012 conference in Hamburg.)

Pelagios phase 1 (Feb – Oct 2011) had established the concept that you can link online stuff about the ancient world by using a lightweight framework, based on the concept of place (a Pleiades URI) and a standard ontology (Open Annotation Collaboration). Its guiding principles have been Openness and Decentralization—we store no data ourselves centrally but rather enable connections between different datasets to be made (based on common references to places). Building on this “bottom-up” infrastructure, Pelagios phase 2 (Nov 2011 – Jul 2012) has produced four outcomes:
1.     an indexing service that allows any ancient world scholar working in the digital medium to make their data discoverable;
2.     an API (an interface allowing computers to communicate with each other) that enables other users and data-providers to discover relevant data and do interesting things with them;
3.     a suite of visualization services including widgets that empowers any interested party to find out more about the ancient world—through literature, archaeological finds, visual imagery, maps, etc.
4.     the Pelagios “cookbook”, into which the community’s wisdom and experience has been poured and distilled.

Successes
The Pelagios API has provided at least three quick wins. It helps provide Context for those hosting data online, by allowing you to obtain links to online material that may be relevant to your own. It facilitates Discovery of your data, so that any web-user can find your resources by following links on other partners’ sites. Finally it allows Reuse by providing machine-readable representations (JSON, RDF) by means of which you can mash-up the data you find in ways you want.
The Pelagios API in action

The suite of visualization tools that we’ve been developing illustrates just some ways the API can be used: so, we have created widgets that can be embedded on partners’ websites that enable place searches, a “heat map” that shows annotations within the Pelagios cloud on a map by virtue of their density, and the Graph Explorer, which allows users to search for connections between places in documents or find out about the documents that reference a particular place. Perhaps even more exciting is to see what partners are making of the API themselves. So, for example, Nick Rabinowitz and Sebastian Heath have developed a JavaScript library for Ancient World Linked Data, “awld.js”, which adds functionality to a website by providing a pop-up preview of Web links to Pelagios references for a place, simply by virtue of you passing your browser over the place-name.

The number of partners has grown appreciably. In addition to the “originals” from phase 1 (Pleiades, Arachne, GAP, nomima.org, Perseus Digital Library, SPQR), Pelagios2 introduced CLAROS, Open Context and Ure Museum at the outset, and have since been joined by the following: the British Museum, Fasti Online, Inscriptions of Israel / Palestine, Meketre, OCRE, ORACC, Papyri.info, Ports Antiques and Regnum Francorum Online. It is exciting to note that some of these new partners, such as ORACC—or, to give it its full title, the Open Richly Annotated Cuneiform Corpus—extend the Pelagios family into new geographical areas (i.e. the Near East and Egpyt). And this is important not only for challenging the still dominant “eurocentric” vision of antiquity but also because it more accurately reflects the interconnected nature of the ancient world. By doing so, it opens up a whole new range of potentially exciting linkages.

Challenges
This wouldn’t be nearly such an exciting, or fun, project if it didn’t throw up the odd occasional difficulty. These have tended to focus on the process of data alignment, which is not surprising since mapping your place references to Pleiades is the hardest part. On the one hand, Aggregating Data is inevitably challenging since no two datasets are the same, and the process has thrown up questions of how to label appropriately (references, data containing the reference), what kind of dataset partitions to have (no subsets vs. multiple levels of hierarchy), and how to keep Pelagios up-to-date of changes you may make to the annotations. On the other hand, we have found that the process of alignment has obliged partners to think about how they are Conceptualizing Data in the first place: i.e. how they are expressing the relation between data and place, such as find-spot vs. origin, uncertain references (probably made in, from the vicinity of), different levels of granularity or specificity (South Italy, Greek Islands, etc.). Because computers are unable to make the “semantic leap”, as humans we have to be a lot clearer about what it is we think we’re doing. To find out about how the partners tackled some of these issues, you can browse through the blog (summarised here in our cookbook) and join the pelagios-group mailing list, where you can also share your experiences.

Pelagios has also been very concerned that all our visible outcomes—the suite of visualizations especially—make sense to everyone. Accordingly, we have been conducting robust and iterative user-testing throughout development, keeping in mind the “Child of 10” standard: for the results of this phase 2 testing, see here and here (and for phase 1, here). But we can still do much better. Part of this perhaps might be better managing the expectations of our home constituency (ancient world scholars), whose excitement at the prospect of being able to gather all different kinds of information about antiquity suggests to them that we’re hosting it—i.e. that we’re a kind of Ancient Wikipedia. Remember: Pelagios is expressly not “one ring to rule them all”, but a means of facilitating connections. Getting out the message that this is in fact a community to which they can also contribute will continue to be central to our mission. Still, this enthusiasm shows that there’s a huge appetite for drawing on, and contributing to, content that is free, open and linkable to across the web.
Pelagios: not “one ring to rule them all”


Futures
Pelagios continues to go from strength to strength. We’re currently in negotiation with another potential partner, which would increase our geographic scope considerably—all the way to ancient China! There has also been discussion about extending the Pelagios “keep it simple”/ “bottom-up” approach to other kinds of common references, such as time periods or people’s names. But to fulfil any of these possibilities will require as much input from our partners and others as Pelagios has been blessed to receive—and we are extremely grateful for everybody’s support!

Leif has much more to say about these aspects in a forthcoming post. Personally speaking, now that we have a working bottom-up infrastructure in place, I would like to see web-users, ordinary non-technical browsers like me, working with the data between which Pelagios enables you to draw connections. For the study of the ancient world—what we in the trade call “Classics” or “Classical Civilization”— is an interdisciplinary subject that encompasses literary texts, material culture, visual artefacts and conceptual ways of thinking. The digital environment affords possibilities for mashing-up and exploring all these different kinds of data in ways that before were simply not imaginable but which are the essence of our subject. With its partners, Pelagios is helping to lay the foundations for the study of the ancient world in the twenty first century.

Pelagios WP2 at Glance: Discovery Services


Whereas WP1 shows how Pelagios RDF annotations can be discovered, aggregated and served via a basic API, WP2 focused on the specifically spatial elements of what we were doing. In particular, our goals were to:
  1. develop services to provide ranked, relevant materials based on input of place URIs and Named Entities or spatial coordinates.
  2. provide super users with specific APIs that permit them to perform federated place- and space-based queries over the resources catalogued by WP1.
  3. enrich results with additional data from sources such as GeoNames, DBpedia and Freebase, returned in a variety of optional Web formats (RDF, JSON, KML, Atom)

In order to achieve these Rainer extended the standard API so that, in addition to returning annotations associated with a single resources, those from multiple places within a co-ordinate bounding box could be returnedThis is very useful for instances in which the relevant coordinates are known, but users are often interested in mereological (part-whole) relationships: returning annotations for all the places in Latium, for example. To accomplish this, Gianluca made use of the online spatial database CartoDB and a shape file of Roman provinces kindly provided the DARMC project. This allows us to create performant spatial queries by first requesting annotations from the Pelagios API filtered by a bounding box, and then filtering it a second time again against a regional polygon.


The principle difficulty encountered with this approach is one of data granularity. We only have approximate boundaries for Roman provinces most of the time, and these are fluid over time. Indeed, in many cases boundaries in Antiquity were only ever approximately defined in the first place. While better polygon datasets will certainly help us with coarse-grained queries, we will need to accept that any such results must be considered provisional at best and should be subjected to further scrutiny. One long term aim may be to create RDF associations between places and their regional affiliations which can remain spatially independent.


We had originally intended to automatically provide additional content associated with GeoNames, Wikipedia and Freebase, but it later occurred to us that this goes against the grain of Pelagios. These are resources just like all our other partners and it makes sense to treat them as such. As a result, we are converting Pleiades+ into an RDF annotation of GeoNames resources, (and where available, wikipedia and Freebase) that can be incorporated directly through the Pelagios API. These will come online in early August.